Contents
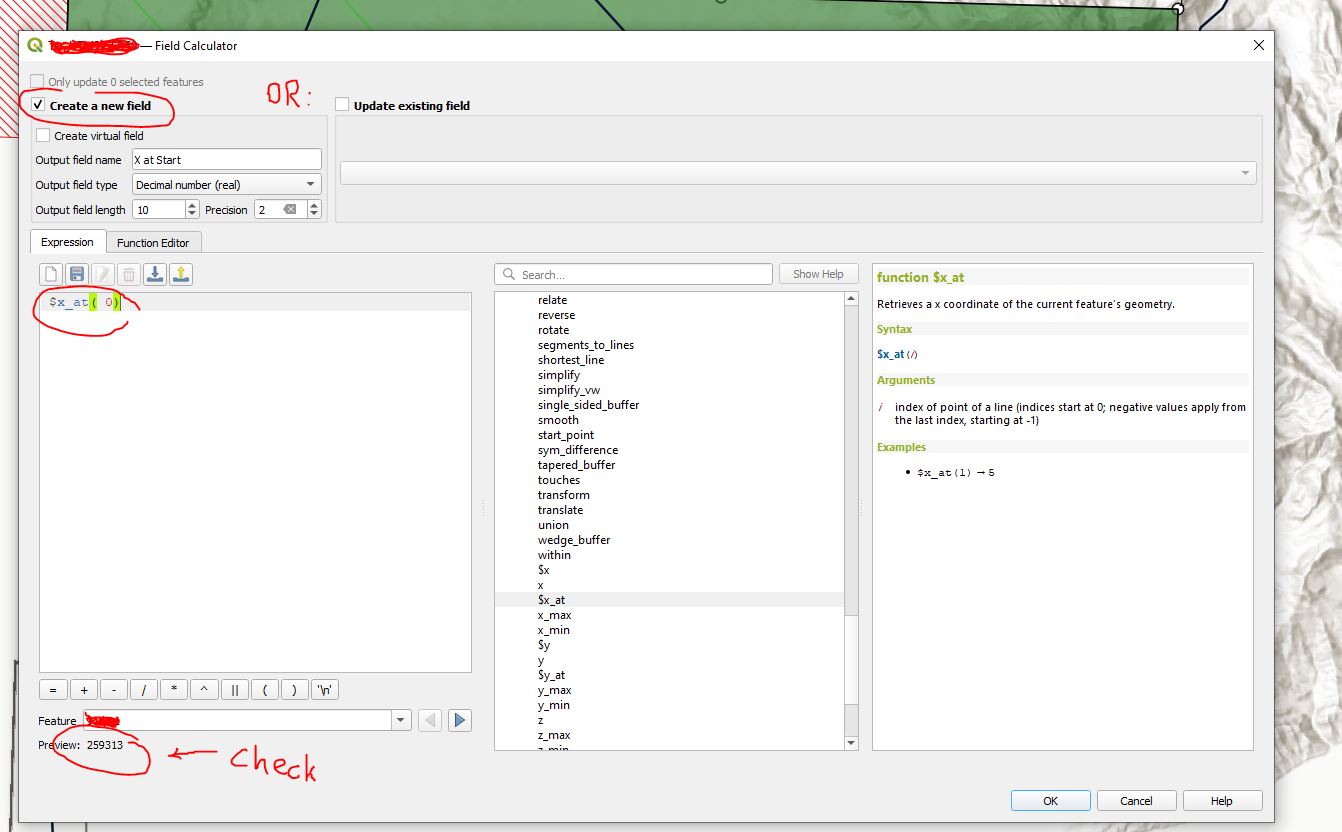
Deriving useful information from attributes in QGIS is easy. Open the attribute table>toggle editing>add Field>Pick proper variable type (e.g. Decimal). Then once the field is created, click on the calculator>Update exiting field>Pick Geometry from the list of functions and therein you'll find some useful functions such as:
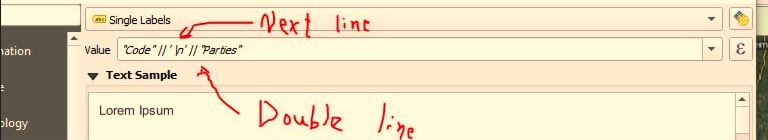
Sometimes you want more than one field in your label. Use two vertical lines to append to the end of the label, and the \n operator to force a new line. See the example below for 2 fields in separate lines
You can always edit a polygon shapefile in all GIS suites, by adding points wherever you like. However, often the regulators will expect a sensible shape for a permit, with right angles, or with the vertices drawn at integer minutes of arc, or sensible subdivisions like 30 seconds of arc. It would be a laborious process to work out the vertex coordinates and manually type them in. It is much easier to ask the software to "snap" to certain values.
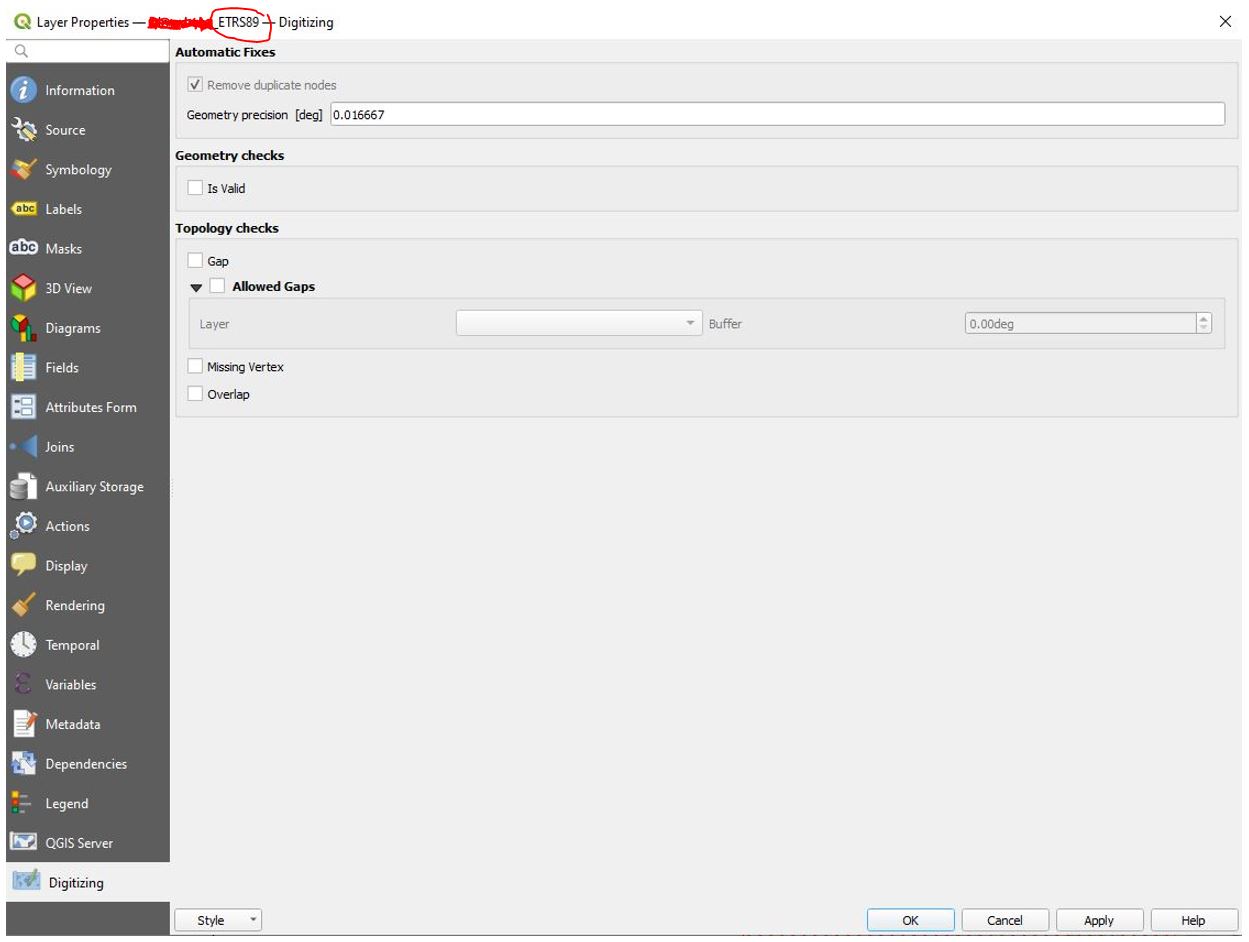
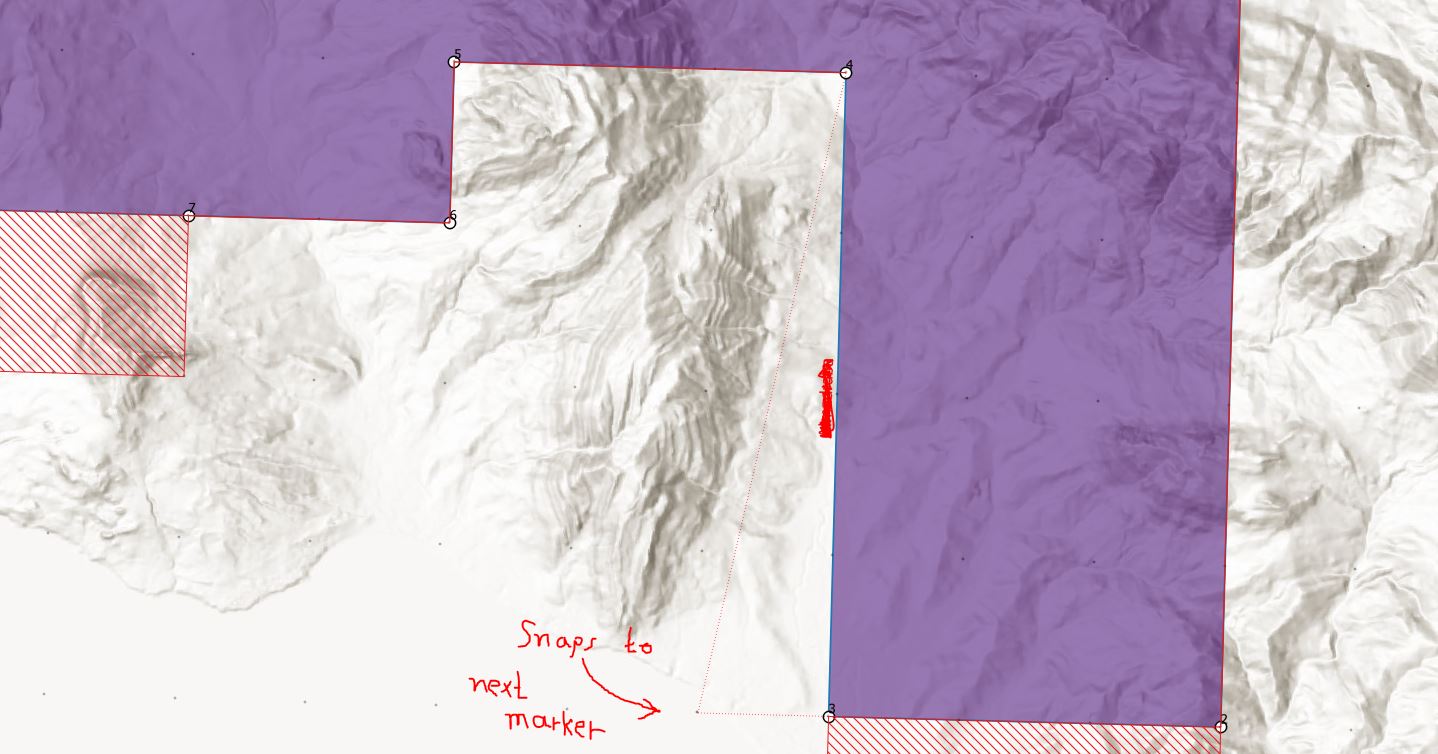
In QGIS you can determine this by specific layer. Make sure you have a shapefile in the desired CRS of the regulator, go to Properties>Digitising>Geometry Precision and set to the desired interval. In the example below, a minute of arc, which is 1/60 of a degree, is set to 0.016667, to only allow vertices at integer minutes of arc.
When this is defined, QGIS will display subtle grid markers corresponding to the available locations for digitising. These will appear automatically if you select the layer, toggle editing and then select the vertex editing tool. Note in the image below vertex 3 is about to snap onto the next available point to the West.
Kingdom (TKS) allows Grid exports in the following 4 formats: Zmap+ default, ISO Zmap+, GFX-3 and XYZ columnar. The table below summarises my experiences with these formats and I hope it will save you some trouble:
| Format | Time Domain? | Depth Domain? | Handles Holes? | Requires Orthogonal extent? | Comments |
|---|---|---|---|---|---|
| Zmap+ default | No | No | Even no-null, orthogonal grids failed in time and depth; Couldn't test | Even no-null, orthogonal grids failed in time and depth; Couldn't test | Do not use this format for QGIS imports, it fails every time. Apparently Petrel loads them just fine though |
| ISO Zmap+ | Yes | Yes | Multiple succesfull attempts with holes, but they sometimes cause errors? | Have been able to load wonky grids and non-integer intervals, but sometimes Block Iread offset fails for unknown reason | Hit or miss and I don't understand why. When it works, it saves you having to cut the grid in QGIS. See XYZ below |
| GFX-3 | No | No | Even no-null, orthogonal grids failed in time and depth; Couldn't test | Even no-null, orthogonal grids failed in time and depth; Couldn't test | Avoid. Keeps saying that it does not support vertically orientated images, but fails with landscape grids as well |
| XYZ Columnar | Yes | Yes | Strictly not allowed | Strictly yes. No wonky grids allowed. | Works every time regardless of domain or data type - but will NOT tolerate nulls and demands rectangular grid. The downside is you then have to import the fault polygons and cut the grid in QGIS |
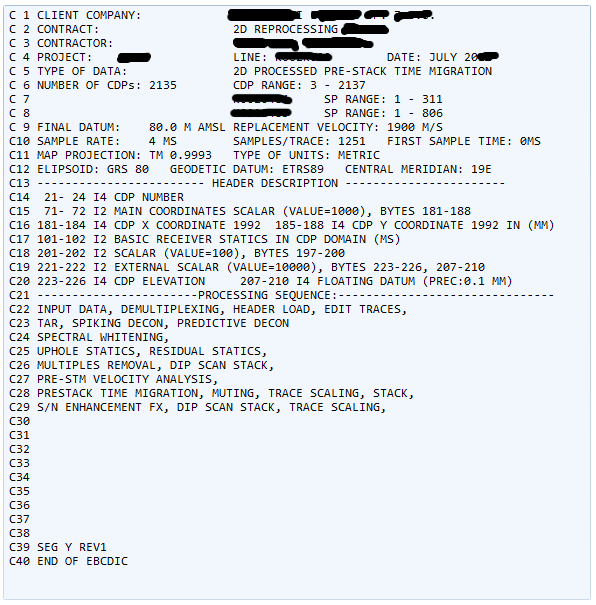
The EBCIDIC header (pronounced Ebb-See-dik) is a human-readable portion at the start of the SEGY file that should (in an ideal world) give you all the necessary information to load your seismic.
Here's what it looks like:
In line C16 the EBCIDIC tells us that the contractor have stored the X coordinates in bytes 181 through 184. That is 4 bytes:
There are 8 bits to a byte so this is 32-bit format (4 times 8). Select this format if your software asks.
Note that it also says "in MM" (which is millimeters) so if your software asks for a scale factor, it needs to be 0.001. This is because it normally expects meters.
In the absence of explicit information in the header, you would have to start looking at Projected Coordinate systems in your area of interest. Which projected CRS was popular at the time of acquisition? Or if the lines are reprocessed, which projected CRS are they likely to have processed them to? I've picked this EBCIDIC because it's a particularly tricky one. The contractor hasn't explicitly provided the EPSG code and there aren't many clues in the text. Perhaps they expect anyone working in this country to be familiar with the dominant Projected CRS for seismic. Sometimes you might be working with legacy data and the original processing centre has been shut down and there's no one to ask. Perhaps there's been a corporate take-over and the data of a smaller company has been placed in a dataroom with no adequate documentation
In line C11 they mention TM 0.9993, so when you've seen a few of these you realise TM likely stands for Transverse Mercator and 0.9993 is probably the scale factor at the central meridian. This is NOT UTM and you can realise this from two clues. The easiest way is to notice in line C12, the central meridian is 19E. There is no UTM zone with central meridian at 19. Recall the 60 UTM zones are each 6 degrees wide the first one from -180 to -174 and therefore centered on -177. The next one would be centered on -171 then -165 and so on. So there is a UTM zone centered on 21 degrees east (zone 34) and a UTM zone centered on 15 degrees east (zone 33) but no UTM zone centered on 19E.
The second way you can tell is because UTM scale factor is set to 0.9996 not 0.9993 like they use here - but this is more obscure.
So what system is this??? It's some Transverese mercator centered on 19 East with scale factor 0.9993 with datum ETRS1989. If you Google these parameters you will see Polish system CS92 comes up. This also explains the random mentions of "1992" after the word "coordinate" in line C16. If you knew the project was in Poland to begin with, it would have been much easier, but this shows you can sometimes derive the CRS, although it should be the absolute last resort. Talk to the vendor if this is a dataroom - ask to see the processing reports. Ask to see the field navigation reports if you have to. Both these options are better than making a guess!
Answer: EPSG code 2180
Let's look at an easier one
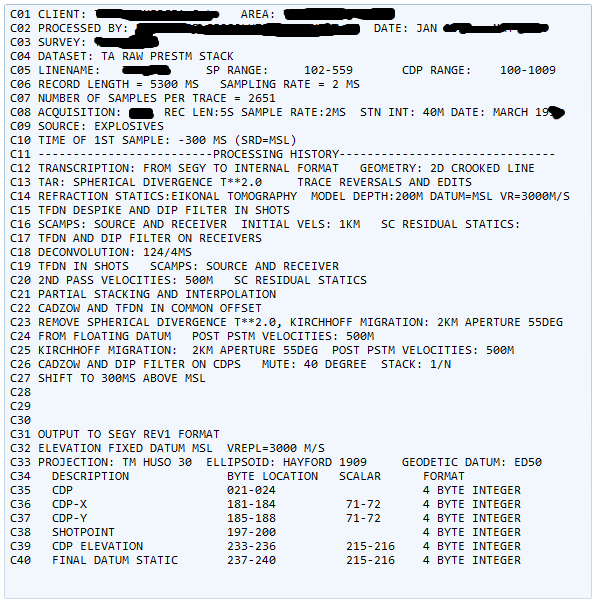
Line C33 clearly says TM "something" 30, on datum ED50. Safe to assume this is UTM zone 30 on the old european datum (ED50). Not to be confused with UTM zone 30 on more modern datums such as ETRS89. This line is in Spain so, again if you know this, it makes perfect sense because Spain spans zones 29 and 30.
Answer: EPSG code 23030
What happens if I have several campaigns from different coordinate systems? Let's say I have 20 seismic lines in UTM30ED50 and 20 lines in UTM30WGS84. Or Data spanning 2 zones?
First decide on a TARGET CRS and stick with it. This will be the CRS that the entire seismic project will be in, and everything has to be normalised to that. You might want to choose something that uses WGS84* as a datum so that any random person with a phone or a GPS can give you reasonably accurate coordinates if they ever visit the wellsite, without any need for conversion.
*ETRS89 is treated the same as WGS84 by nearly all systems although in theory one moves with the eurasian plate and the other does not. The "towgs" transformation of ETRS89 is currently 0, which means they are the same, so it's okay to use ETRS89.
Proceed to load all the SEG-Y as if they were referenced to the same CRS. The next step is to export the navigation from the seismic lines (source CRS) that you want to shift, in our case the 20 lines that are referenced to ED50. In other words, this means the lines that are of a CRS (source CRS) that is not the same as desired project CRS (target CRS). Most interpretation packages allow you to export the information as spreadsheet, csv or txt files, see picture below.
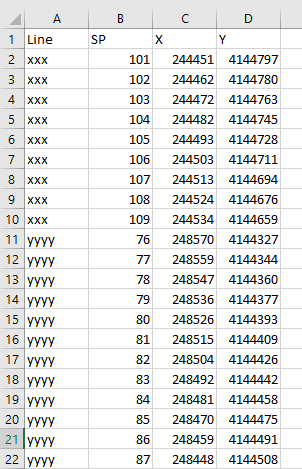
Each line might have hundreds of shotpoints. Load this into any GIS software, making sure to define the "source CRS" on import. That is the CRS defined in the EBCIDIC. It will probably load as "points" rather than line but it makes no difference there is no need to change the geometry to "lines". Do the transformation in the GIS software (depending on your package this might be "export as csv" providing the new CRS on export, or "Reproject" or "gdalwrap" etc). QC the results to make sure the points have shifted.
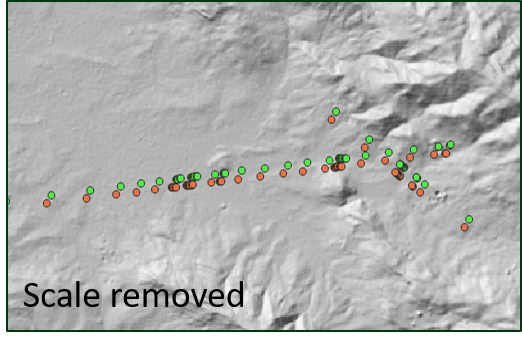
The picture shows the shifted shotpoints (from red to green), for a couple of lines done in QGIS, but almost any GIS package will do. You can then go back to your seismic software, open the navigation survey spreadsheet and paste the new values, overwriting the old coordinates). In most packages this won't affect the original SEG-Y, only the loaded lines in the project. Most loaded seismic is saved in proprietary formats anyway that sit separate to the original SEG-Y, so the original lines are unaffected. AVOID exporting new SEGY files after you've edited coordinates or overwriting the original files from the contractor. If you manage to write a SEGY file where the coordinates do not match the EBCIDIC description it will be nigh impossible for future interpreters to reconcile the errors, especially with subtle differences in the order or a few meters.
Sometimes, even if you have picked the correct CSR for a project, the transformation from XYs to the Lat-Long of the well will have some small errors. Most of the time this has nothing to do with going from a projected CRS to a geographic CRS, it's got to do with going from one datum to another datum.
As outlined in the theory section, going from one datum to another can be achieved with a 7-parameter transformation, also called a Helmert transformation after Friedrich Robert Helmert. The wikipedia page on this is very solid, but let's look at a real life example.
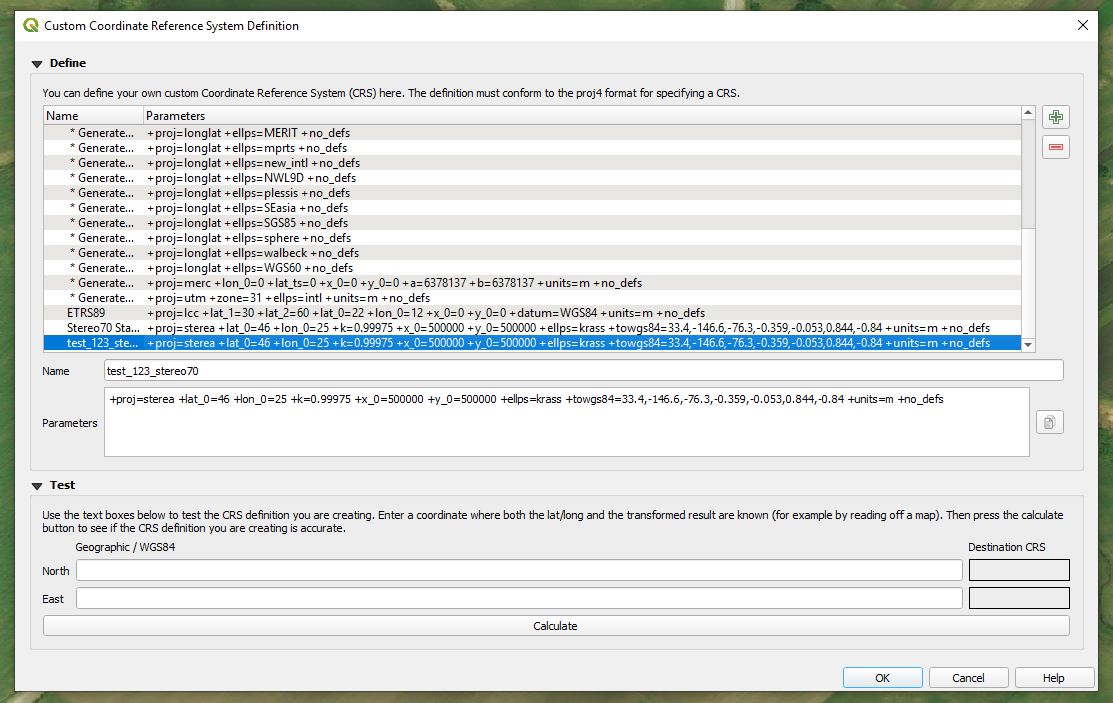
The proj4 string in the CRS definition will include the 7 Helmert parameters if a datum shift is required. In QGIS, the Pulkovo1942(58)Stereo70 system is defined as:
+proj=sterea +lat_0=46 +lon_0=25 +k=0.99975 +x_0=500000 +y_0=500000 +ellps=krass +towgs84=2.329,-147.042,-92.08,0.309,-0.325,-0.497,5.69 +units=m +no_defs
This is not the same as the EPSG definition:
+proj=sterea +lat_0=46 +lon_0=25 +k=0.99975 +x_0=500000 +y_0=500000 +ellps=krass +towgs84=33.4,-146.6,-76.3,-0.359,-0.053,0.844,-0.84 +units=m +no_defs
Note for example the first term after "towgs84" should be 33.4 meters, but is 2.329. I'm unsure of how this alternative definition came about, although there are various discussions on online forums. Whatever the case, it stands to reason that these two different transformations will result in different Lat-Long when you convert the well coordinates into WGS84.
To address this simply go to Settings>Custom Projections and create you own CRS. You can call it whatever you like. Make sure you paste the proj4 string from the EPSG website like this: